Why are commodity prices, including oil prices, lagging? Ultimately, the question comes back to, “Why isn’t the world economy making very many of the end products that use these commodities?” If
workers were getting rich enough to buy new homes and cars, demand for
these products would be raising the prices of commodities used to build
and operate cars, including the price of oil. If governments were rich
enough to build an increasing number of roads and more public housing,
there would be demand for the commodities used to build roads and public
housing.
It looks to me as though we are heading into a
deflationary depression, because the prices of commodities are falling
below the cost of extraction. We need rapidly rising wages and debt if
commodity prices are to rise back to 2011 levels or higher. This isn’t
happening. Instead, Janet Yellen is talking about raising interest rates
later this year, and we are seeing commodity prices fall further and further. Let me explain some pieces of what is happening.
1.
We have been forcing economic growth upward since 1981 through the use
of falling interest rates. Interest rates are now so low that it is hard
to force rates down further, in order to encourage further economic
growth. Falling interest rates are hugely beneficial for
the economy. If interest rates stop dropping, or worse yet, begin to
rise, we will lose this very beneficial factor affecting the economy.
The economy will tend to grow even less quickly, bringing down commodity
prices further. The world economy may even start contracting, as it
heads into a deflationary depression.
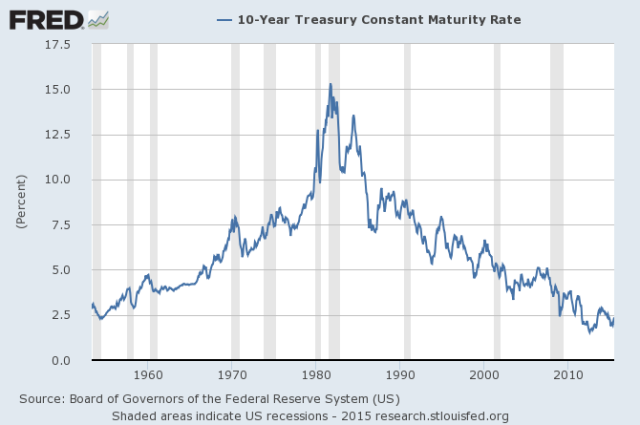
If we look at 10-year US treasury interest rates, there has been a steep fall in rates since 1981.
Figure 1. Chart prepared by St. Louis Fed using data through July 20, 2015.
In
fact, almost any kind of interest rates, including interest rates of
shorter terms, mortgage interest rates, bank prime loan rates, and
Moody’s Seasoned AAA Bonds, show a fairly similar pattern. There is more
variability in very short-term interest rates, but the general
direction has been down, to the point where interest rates can drop no
further.
Declining interest rates stimulate the economy for many reasons:
- Would-be homeowners find monthly payments are lower, so more people can afford to purchase homes. People already owning homes can afford to “move up” to more expensive homes.
- Would-be auto owners find monthly payments lower, so more people can afford cars.
- Employment in the home and auto industries is stimulated, as is employment in home furnishing industries.
- Employment at colleges and universities grows, as lower interest rates encourage more students to borrow money to attend college.
- With lower interest rates, businesses can afford to build factories and stores, even when the anticipated rate of return is not very high. The higher demand for autos, homes, home furnishing, and colleges adds to the success of businesses.
- The low interest rates tend to raise asset prices, including prices of stocks, bonds, homes and farmland, making people feel richer.
- If housing prices rise sufficiently, homeowners can refinance their mortgages, often at a lower interest rate. With the funds from refinancing, they can remodel, or buy a car, or take a vacation.
- With low interest rates, the total amount that can be borrowed without interest payments becoming a huge burden rises greatly. This is especially important for governments, since they tend to borrow endlessly, without collateral for their loans.
While
this very favorable trend in interest rates has been occurring for
years, we don’t know precisely how much impact this stimulus is having
on the economy. Instead, the situation is the “new normal.” In some
ways, the benefit is like traveling down a hill on a skateboard, and not
realizing how much the slope of the hill is affecting the speed of the
skateboard. The situation goes on for so long that no one notices the
benefit it confers.
If the economy is now moving too slowly, what
do we expect to happen when interest rates start rising? Even level
interest rates become a problem, if we have become accustomed to the
economic boost we get from falling interest rates.
2.
The cost of oil extraction tends to rise over time because the cheapest
to extract oil is removed first. In fact, this is true for nearly all
commodities, including metals.
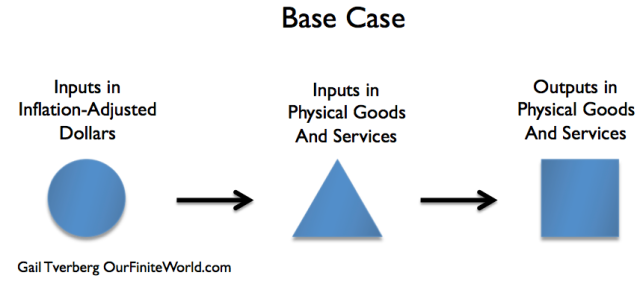
If costs always remained
the same, we could represent the production of a barrel of oil, or a
pound of metal, using the following diagram.
If
production is becoming increasingly efficient, then we might represent
the situation as follows, where the larger size “box” represents the
larger output, using the same inputs.
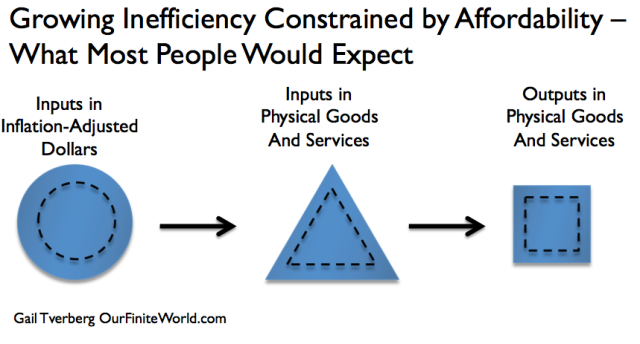
For
oil and for many other commodities, we are experiencing the opposite
situation. Instead of becoming increasingly efficient, we are becoming
increasingly inefficient (Figure 4). This happens because deeper wells
need to be dug, or because we need to use fracking equipment and
fracking sand, or because we need to build special refineries to handle
the pollution problems of a particular kind of oil. Thus we need more
resources to produce the same amount of oil.
Some people might call the situation “diminishing returns,”
because the cheap oil has already been extracted, and we need to move
on to the more difficult to extract oil. This adds extra steps, and thus
extra costs. I have chosen to use the slightly broader term of
“increasing inefficiency” because it indicates that the nature of these
additional costs is not being restricted.
Very often, new steps
need to be added to the process of extraction because wells are deeper,
or because refining requires the removal of more pollutants. At times,
the higher costs involve changing to a new process that is believed to
be more environmentally sound.
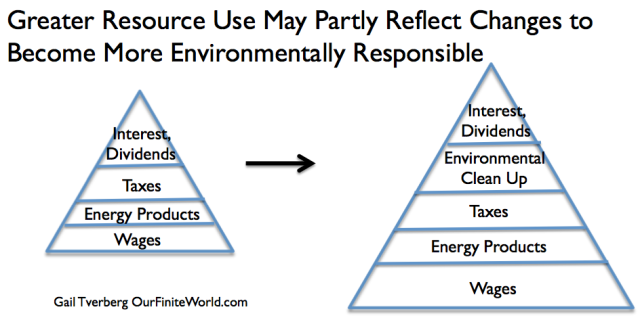
Figure
5. An example of what may happen to make inputs in physical goods and
services rise. (The triangle shape was chosen to match the shape of the
“Inputs of Goods and Services” triangle in Figures 2, 3, and 4.)
The
cost of extraction keeps rising, as the cheapest to extract resources
become depleted, and as environmental pollution becomes more of a
problem.
3. Using more inputs to create the same or smaller output pushes the world economy toward contraction.
Essentially,
the problem is that the same quantity of inputs is yielding less and
less of the desired final product. For a given quantity of inputs, we
are getting more and more intermediate products (such as fracking sand, “scrubbers”
for coal-fired power plants, desalination plants for fresh water, and
administrators for colleges), but we are not getting as much output in
the traditional sense, such as barrels of oil, kilowatts of electricity,
gallons of fresh water, or educated young people, ready to join the
work force.
We don’t have unlimited inputs. As more and more of
our inputs are assigned to creating intermediate products to work around
limits we are reaching (including pollution limits), fewer of our
resources can go toward producing desired end products. The result is
less economic growth. Because of this declining economic growth, there
is less demand for commodities. So, prices for commodities tend to drop. This outcome is to be expected, if increased efficiency is part of what creates economic growth, and what we are experiencing now is the opposite: increased inefficiency.
4.
The way workers afford higher commodity costs is primarily through
higher wages. At times, higher debt can also be a workaround. If neither
of these is available, commodity prices can fall below the cost of
production.
If there is a significant increase in the
cost of products like houses and cars, this presents a huge challenge to
workers. Usually, workers pay for these products using a combination of
wages and debt. If costs rise, they either need higher wages, or a debt
package that makes the product more affordable–perhaps lower rates, or a
longer period for payment.
Commodity costs have been rising very rapidly in the last fifteen years or so. According to a chart prepared by Steven Kopits, some of the major costs of extracting oil began increasing by 10.9% per
year, in about 1999.

Figure
6. Figure by Steve Kopits of Westwood Douglas showing trends in world
oil exploration and production costs per barrel. CAGR is “Compound
Annual Growth Rate.”
In fact, the inflation-adjusted prices
of almost all energy and metal products tended to rise rapidly during
the period 1999 to 2008 (Figure 7). This was a time period when the amount
of mortgage debt was increasing rapidly as lenders began offering home
loans with low initial interest rates to almost anyone, including
those with low credit scores and irregular income. When debt levels
began falling in mid-2008 (related in part to defaulting home loans),
commodity prices of all types dropped.
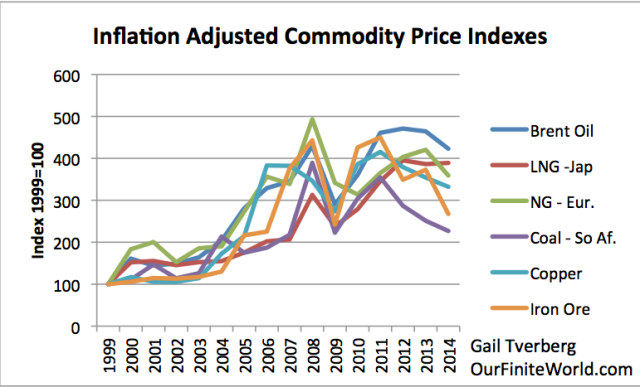
Figure 6. Inflation adjusted prices adjusted to 1999 price = 100, based on World Bank “Pink Sheet” data.
Prices
then began to rise once Quantitative Easing (QE) was initiated (compare
Figures 6 and 7). The use of QE brought down medium-term and long-term
interest rates, making it easier for customers to afford homes and cars.
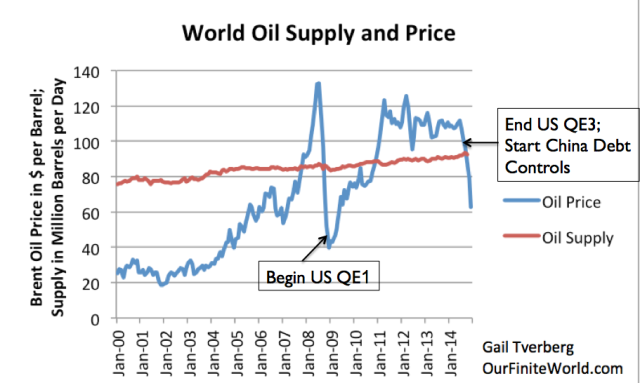
Figure
7. World Oil Supply (production including biofuels, natural gas
liquids) and Brent monthly average spot prices, based on EIA data.
More
recently, prices have fallen again. Thus, we have had two recent times
when prices have fallen below the cost of production for many major
commodities. Both of these drops occurred after prices had been high,
when debt availability was contracting or failing to rise as much as in
the past.
5. Part of the problem that we are experiencing is a slow-down in wage growth.
Figure
8 shows that in the United States, growth in per capita wages tends to
disappear when oil prices rise above $40 barrel. (Of course, as noted in
Point 1, interest rates have been falling since 1981. If it weren’t for
this, the cut off for wage growth might even be lower–perhaps even $20
barrel!)
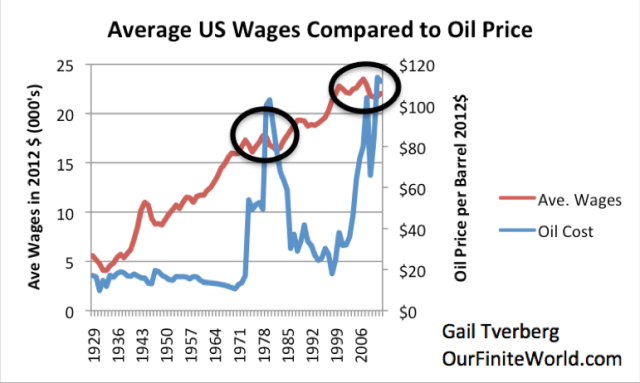
Figure
8. Average wages in 2012$ compared to Brent oil price, also in 2012$.
Average wages are total wages based on BEA data adjusted by the
CPI-Urban, divided by total population. Thus, they reflect changes in
the proportion of population employed as well as wage levels.
There
is also a logical reason why we should expect that wages would tend to
fall as energy costs rise. How does a manufacturer respond to the much
higher cost of one or more of its major inputs? If the manufacturer
simply passes the higher cost along, many customers will no longer be
able to afford the manufacturer’s or service-provider’s products. If
businesses can simply reduce some other costs to offset the rise in the
cost in energy products and metals, they might be able to keep most of
their customers.
A major area where a manufacturer or service
provider can cut costs is in wage expense. (Note the different types of
expenses shown in Figure 5. Wages are a major type of expense for most
businesses.)
There are several ways employment costs can be cut:
- Shift jobs to lower wage countries overseas.
- Use automation to shift some human labor to labor provided by electricity.
- Pay workers less. Use “contract workers” or “adjunct faculty” or “interns” who will settle for lower wages.
If
a manufacturer decides to shift jobs to China or India, this has the
additional advantage of cutting energy costs, since these countries use a
lot of coal in their energy mix, and coal is an inexpensive fuel.

Figure
9. United States Labor Force Participation Rate by St. Louis Federal
Reserve. It is computed by dividing the number of people who are
employed or are actively looking for work by the number of potential
workers.
In fact, we see a drop in the US civilian labor
force participation rate (Figure 9) starting at approximately the same
time when energy costs and metal costs started to rise. Median
inflation-adjusted wages have tended to fall as well in this period. Low
wages can be a reason for dropping out of the labor force; it can
become too expensive to commute to work and pay day care expenses out of
meager wages.
Of course, if wages of workers are not growing and
in many cases are actually shrinking, it becomes difficult to sell as
many homes, cars, boats, and vacation cruises. These big-ticket items
create a significant share of commodity “demand.” If workers are unable
to purchase as many of these big-ticket items, demand tends to fall
below the (now-inflated) cost of producing these big-ticket items,
leading to the lower commodity prices we have seen recently.
6. We are headed in slow motion toward major defaults among commodity producers, including oil producers.
Quite
a few people imagine that if oil prices drop, or if other commodity
prices drop, there will be an immediate impact on the output of goods
and services.
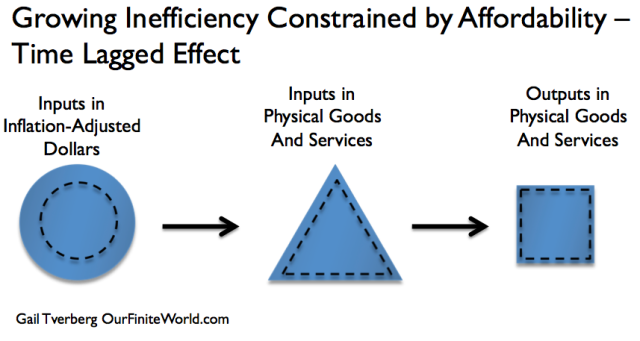
Instead, what happens is more of a time-lagged effect (Figure 11).
Part
of the difference lies in the futures markets; companies hold contracts
that hold sale prices up for a time, but eventually (often, end of
2015) run out. Part of the difference lies in wells that have already
been drilled that keep on producing. Part of the difference lies in the
need for businesses to maintain cash flow at all costs, if the price
problem is only for a short period. Thus, they will keep parts of the
business operating if those parts produce positive cash flow on a
going-forward basis, even if they are not profitable considering all
costs.
With debt, the big concern is that the oil reserves being used as collateral for loans will drop in value, due
to the lower price of oil in the world market. The collateral value of
reserves works out to be something like (barrels of oil in reserves x
some expected price).
As long as oil is being valued at $100
barrel, the value of the collateral stays close to what was assumed when
the loan was taken out. The problem comes when low oil prices gradually
work their way through the system and bring down the value of the
collateral. This may take a year or more from the initial price drop,
because prices are averaged over as much as 12 months, to provide
stability to the calculation.
Once the value of the collateral
drops below the value of the outstanding loan, the borrowers are in big
trouble. They may need to sell some of the other assets they own, to
help pay down the loan. Or, they may end up in bankruptcy. The borrowers
certainly can’t borrow the additional money they need to keep
increasing their production.
When bankruptcy occurs, many
follow-on effects can be expected. The banks that made the loans may
find themselves in financial difficulty. The oil company may lay off
large numbers of workers. The former workers’ lack of wages may affect
other businesses in the area, such as car dealerships. The value of
homes in the area may drop, causing home mortgages to become
“underwater.” All of these effects contribute to still lower demand for
commodities of all kinds, including oil.
Because of the time lag
problem, the bankruptcy problem is hard to reverse. Oil prices need to
stay high for an extended period before lenders will be willing to lend
to oil companies again. If it takes, say, five years for oil prices to get up to a level high enough to encourage drilling again, it may take seven years before lenders are willing to lend again.
7.
Because many “baby boomers” are retiring now, we are at the beginning
of a demographic crunch that has the tendency to push demand down
further.
Many workers born in the late 1940s and in
the 1950s are retiring now. These workers tend to reduce their own
spending, and depend on government programs to pay most of their income.
Thus, the retirement of these workers tends to drive up governmental
costs at the same time it reduces demand for commodities of all kinds.
Someone
needs to pay for the goods and services used by the
retirees. Government retirement plans are rarely pre-funded, except with
the government’s own debt. Because of this, higher pension payments by
governments tend to lead to higher taxes. With higher taxes, workers
have less money left to buy homes and cars. Even with pensions, the
elderly are never a big market for homes and cars. The overall result is
that demand for homes and cars tends to stagnate or decline, holding
down the demand for commodities.
8. We are running short of options for fixing our low commodity price problem.
The
ideal solution to our low commodity price problem would be to find
substitutes that are cheap enough, and could increase in quantity
rapidly enough, to power the economy to economic growth. “Cheap enough”
would probably mean approximately $20 per barrel for a liquid oil
substitute. The price would need to be correspondingly inexpensive for
other energy products. Cheap and abundant energy products are needed
because oil consumption and energy consumption are highly correlated. If
prices are not low, consumers cannot afford them. The economy would
react as it does to inefficiency. In other words, it would react as if
too much of the output is going into intermediate products, and too
little is actually acting to expand the economy.
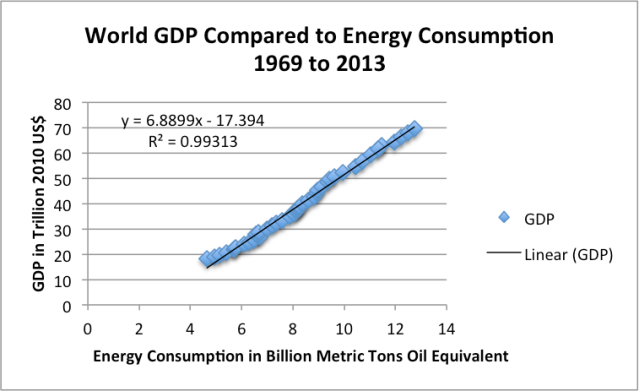
Figure
12. World GDP in 2010$ (from USDA) compared to World Consumption of
Energy (from BP Statistical Review of World Energy 2014)
These
substitutes would also need to be non-polluting, so that pollution
workarounds do not add to costs. These substitutes would need to work in
existing vehicles and machinery, so that we do not have to deal with
the high cost of transition to new equipment.
Clearly, none of the
potential substitutes we are looking at today come anywhere close to
meeting cost and scalability requirements. Wind and solar PV can only be
built on top of our existing fossil fuel system. All evidence is that
they raise total costs, adding to our “Increased Inefficiency” problem,
rather than fixing it. Other solutions to our current problems
seem to be debt based. If we look at recent past history, the story
seems to be something such as the following:
Besides adopting QE
starting in 2008, governments also ramped up their spending (and debt)
during the 2008-2011 period. This spending included road building, which
increased the demand for commodities directly, and unemployment
insurance payments, which indirectly increased the demand for
commodities by giving jobless people money, which they used for food and
transportation. China also ramped up its use of debt in the 2008-2009
period, building more factories and homes. The combination of QE,
China’s debt, and government debt together brought oil prices back up by
2011, although not to as high a level as in 2008 (Figure 7).
More
recently, governments have slowed their growth in spending (and debt),
realizing that they are reaching maximum prudent debt levels. China has
slowed its debt growth, as pollution from coal has become an increasing
problem, and as the need for new homes and new factories has become
saturated. Its debt ratios are also becoming very high.
QE
continues to be used by some countries, but its benefit seems to be
waning, as interest rates are already as low as they can go, and as
central banks buy up an increasing share of debt that might be used for
loan collateral. The credit generated by QE has allowed questionable
investments since the required rate of return on investments funded by
low interest rate debt is so low. Some of this debt simply recirculates
within the financial system, propping up stock prices and land prices.
Some of it has gone toward stock buy-backs. Virtually none of it has
added to commodity demand.
What we really need is more high wage jobs. Unfortunately, these jobs need to be supported by the availability of large amounts of very inexpensive energy.
It is the lack of inexpensive energy, to match the $20 per barrel oil
and very cheap coal upon which the economy has been built that is
causing our problems. We don’t really have a way to fix this.
9. It is doubtful that the prices of energy products and metals can be raised again without causing recession.
We
are not talking about simply raising oil prices. If the economy is to
grow again, demand for all commodities needs to rise to the point where
it makes sense to extract more of them. We use both energy products and
metals in making all kinds of goods and services. If the price of these
products rises, the cost of making virtually any kind of goods or
services rises.
Raising the cost of energy products and metals
leads to the problem represented by Growing Inefficiency (Figure 4). As
we saw in Point 5, wages tend to go down, rather than up, when other
costs of production rise because manufacturers try to find ways to hold
total costs down. Lower wages and higher prices are a huge
problem. This is why we are headed back into recession if prices rise
enough to enable rising long-term production of commodities, including
oil.
http://www.theenergycollective.com/gail-tverberg/2252055/nine-reasons-why-low-oil-prices-may-morph-something-much-worse



No comments:
Post a Comment