
Most people believe that low oil prices are good for the United
States, since the discretionary income of consumers will rise. There is
the added benefit that Peak Oil must be far off in the distance, since
“Peak Oilers” talked about high oil prices. Thus, low oil prices are
viewed as an all around benefit.
In fact, nothing could be further from the truth.
The Peak Oil story we have been told is wrong. The collapse in oil production comes from oil prices that are too low, not too high. If
oil prices or prices of other commodities are too low, production will
slow and eventually stop. Growth in the world economy will slow,
lowering inflation rates as well as economic growth rates. We
encountered this kind of the problem in the 1930s. We seem to be headed
in the same direction today. Figure 1, used by Janet Yellen in her September 24 speech,
shows a slowing inflation rate for Personal Consumption Expenditures
(PCE), thanks to lower energy prices, lower relative import prices, and
general “slack” in the economy.
Figure 1. “Why has PCE Inflation fallen below 2%?” from Janet Yellen speech, September 24, 2015.
What
Janet Yellen is seeing in Figure 1, even though she does not recognize
it, is evidence of a slowing world economy. The economy can no longer
support energy prices as high as they have been, and they have gradually
retreated. Currency relativities have also readjusted, leading to lower
prices of imported goods for the United States. Both lower energy
prices and lower prices of imported goods contribute to lower inflation
rates.
Instead of reaching “Peak Oil” through the limit of high
oil prices, we are reaching the opposite limit, sometimes called “Limits
to Growth.” Limits to Growth describes the situation when an economy
stops growing because the economy cannot handle high energy prices. In
many ways, Limits to Growth with low oil prices is worse than Peak Oil
with high oil prices. Slowing economic growth leads to commodity prices
that can never rebound by very much, or for very long. Thus, this
economic malaise leads to a fairly fast cutback in commodity production.
It can also lead to massive debt defaults.
Let’s look at some of the pieces of our current predicament.
Part
1. Getting oil prices to rise again to a high level, and stay there, is
likely to be difficult. High oil prices tend to lead to economic
contraction.
Figure 2 shows an illustration I made over five years ago:

Figure 2. Chart made by author in Feb. 2010, for an article called Peak Oil: Looking for the Wrong Symptoms.
Clearly
Figure 2 exaggerates some aspects of an oil price change, but it makes
an important point. If oil prices rise–even if it is after prices have
fallen from a higher level–there is likely to be an adverse impact on
our pocketbooks. Our wages (represented by the size of the circles)
don’t increase. Fixed expenses, including mortgages and other debt
payments, don’t change either. The expenses that do increase in price
are oil products, such as gasoline and diesel, and food, since oil is
used to create and transport food. When the cost of food and gasoline
rises, discretionary spending (in other words, “everything else”)
shrinks.
When discretionary spending gets squeezed, layoffs are
likely. Waitresses at restaurants may get laid off; workers in the home
building and auto manufacturing industries may find their jobs
eliminated. Some workers who get laid off from their jobs may default on
their loans causing problems for banks as well. We start the cycle of
recession and falling oil prices that we should be familiar with, after
the crash in oil prices in 2008.
So instead of getting oil prices
to rise permanently, at most we get a zigzag effect. Oil prices rise for
a while, become hard to maintain, and then fall back again, as
recessionary influences tend to reduce the demand for oil and bring the
price of oil back down again.
Part 2. The world economy
has been held together by increasing debt at ever-lower interest rates
for many years. We are reaching limits on this process.
Back
in the second half of 2008, oil prices dropped sharply. A number of
steps were taken to get the world economy working better again. The US
began Quantitative Easing (QE) in late 2008. This helped reduce
longer-term interest rates, allowing consumers to better afford homes
and cars. Since building cars and homes requires oil (and cars require
oil to operate as well), their greater sales could stimulate the
economy, and thus help raise demand for oil and other commodities.
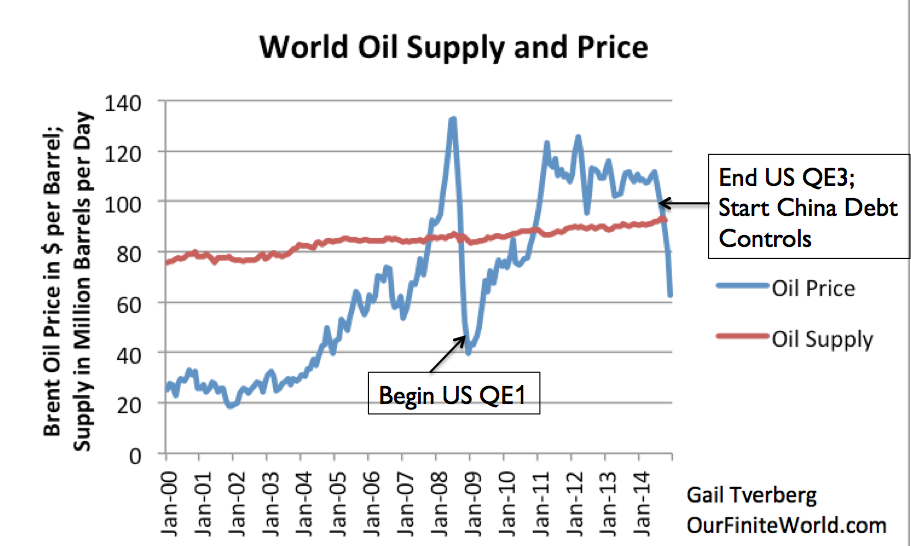 Figure
3. World Oil Supply (production including biofuels, natural gas
liquids) and Brent monthly average spot prices, based on EIA data.
Figure
3. World Oil Supply (production including biofuels, natural gas
liquids) and Brent monthly average spot prices, based on EIA data.
Following the 2008 crash, there were other stimulus efforts as well. China, in particular, ramped up its debt after 2008, as did many governments around the world.
This additional governmental debt led to increased spending on roads
and homes. This spending thus added to the demand for oil and helped
bring the price of oil back up.
These stimulus effects gradually
brought prices up to the $120 per barrel level in 2011. After this,
stimulus efforts gradually tapered. Oil prices gradually slid down
between 2011 and 2014, as the push for ever-higher debt levels faded.
When the US discontinued its QE and China started scaling back on the
amount of debt it added in 2014, oil prices began a severe drop, not too
different from the way they dropped in 2008.
I reported earlier
that the July 2008 crash corresponded with a reduction in debt levels.
Both US credit card debt (Fig. 4) and mortgage debt (Fig. 5) decreased
at precisely the time of the 2008 price crash.
 Figure 4. US Revolving Debt Outstanding (mostly credit card debt) based on monthly data from the Federal Reserve.
Figure 5. US Mortgage Debt Outstanding, based on the Federal Reserve Z1 Report.
At
this point, interest rates are at record low levels; they are even
negative in some parts of Europe. Interest rates have been falling since
1981.
 Figure 6. Chart prepared by the St. Louis Fed using data through July 20, 2015.
I showed in a recent post (How our energy problem leads to a debt collapse problem)
that when the cost of oil production is over $20 per barrel, we need
ever-higher debt ratios to GDP to produce economic growth. This need for
ever-rising debt contributes to our inability to keep commodity prices
high enough to satisfy the needs of commodity producers.
Part
3. We are reaching a demographic bottleneck with the “baby boomers”
retiring. This demographic bottleneck causes an adverse impact on the demand for commodities.
Demand represents the amount of goods customers can afford.
The amount consumers can afford doesn’t necessarily rise endlessly. One
of the problems leading to falling demand is falling inflation-adjusted
median wages. I have written about this issue previously in How Economic Growth Fails.
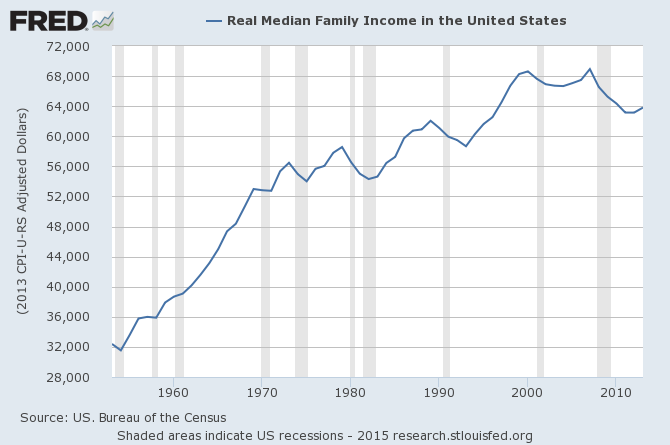 Figure 7. Median Inflation-Adjusted Family Income, in chart prepared by the Federal Reserve of St. Louis.
Another
part of the problem of falling demand is a falling number of
working-age individuals–something I approximate by using estimates of
the population aged 20 to 64. Figure 8 shows how the population of these
working-age individuals has been changing for the United States,
Europe, and Japan.
 Figure 8. Annual percentage growth in population aged 20 – 64, based on UN 2015 population estimates.
Figure
8 indicates that Japan’s working age population started shrinking in
1998 and now is shrinking by more than 1.0% per year. Europe’s working
age population started shrinking in 2012. The United States’ working age
population hasn’t started shrinking, but its rate of growth started
slowing in 1999. This slowdown in growth rate is likely part of the
reason that labor force participation rates have been falling in the
United States since about 1999.
 Figure 9. US Labor force participation rate. Chart prepared by the Federal Reserve of St. Louis.
When
there are fewer workers, the economy has a tendency to shrink. Tax
levels to pay for retirees are likely to start increasing. As the ratio
of retirees rises, those still working find it increasingly difficult to
afford new homes and cars. In fact, if the population of workers aged
20 to 64 is shrinking, there is little need to add new homes for this
group; all that is needed is repairs for existing homes. Many retirees
aged 65 and over would like their own homes, but providing separate
living quarters for this population becomes increasingly unaffordable,
as the elderly population becomes greater and greater, relative to the
working age population.
Figure 10 shows that the population aged
65 and over already equals 47% of Japan’s working age population. (This
fact no doubt explains some of Japan’s recent financial difficulties.)
The ratios of the elderly to the working age population are lower for
Europe and the United States, but are trending higher. This may be a
reason why Germany has been open to adding new immigrants to its
population.
 Figure 10. Ratio of elderly (age 65+) to working age population (aged 20 to 64) based on UN 2015 population estimates.
For
the Most Developed Regions in total (which includes US, Europe, and
Japan), the UN projects that those aged 65 and over will equal 50% of
those aged 20 to 64 by 2050. China is expected to have a similar
percentage of elderly, relative to working age (51%), by 2050. With such
a large elderly population, every two people aged 20 to 64 (not all of
whom may be working) need to be supporting one person over 65, in
addition to the children whom they are supporting.
Demand for
commodities comes from workers having income to purchase goods that are
made using commodities–things like roads, new houses, new schools, and
new factories. Economies that are trying to care for an increasingly
large percentage of elderly citizens don’t need a lot of new houses,
roads and factories. This lower demand is part of what tends to hold
commodity prices down, including oil prices.
Part 4. World oil demand, and in fact, energy demand in general, is now slowing.
If
we calculate energy demand based on changes in world consumption, we
see a definite pattern of slowing growth (Fig.11). I commented on this
slowing growth in my recent post, BP Data Suggests We Are Reaching Peak Energy Demand.
 Figure 11. Annual percent change in world oil and energy consumption, based on BP Statistical Review of World Energy 2015 data.
The
pattern we are seeing is the one to be expected if the world is
entering another recession. Economists may miss this point if they are
focused primarily on the GDP indications of the United States.
World
economic growth rates are not easily measured. China’s economic growth
seems to be slowing now, but this change does not seem to be fully
reflected in its recently reported GDP. Rapidly changing financial
exchange rates also make the true world economic growth rate harder to
discern. Countries whose currencies have dropped relative to the dollar
are now less able to buy our goods and services, and are less able to
repay dollar denominated debts.
Part 5. The low price
problem is now affecting many commodities besides oil. The widespread
nature of the problem suggests that the issue is a demand
(affordability) problem–something that is hard to fix.
Many
people focus only on oil, believing that it is in some way different
from other commodities. Unfortunately, nearly all commodities are
showing falling prices:
 Figure 12. Monthly commodity price index from Commodity Markets Outlook, July 2015. Used under Creative Commons license.
Energy
prices stayed high longer than other prices, perhaps because they were
in some sense more essential. But now, they have fallen as much as other
prices. The fact that commodities tend to move together tends to hold
over the longer term, suggesting that demand (driven by growth in debt, working age population, and other factors) underlies many commodity price trends simultaneously.
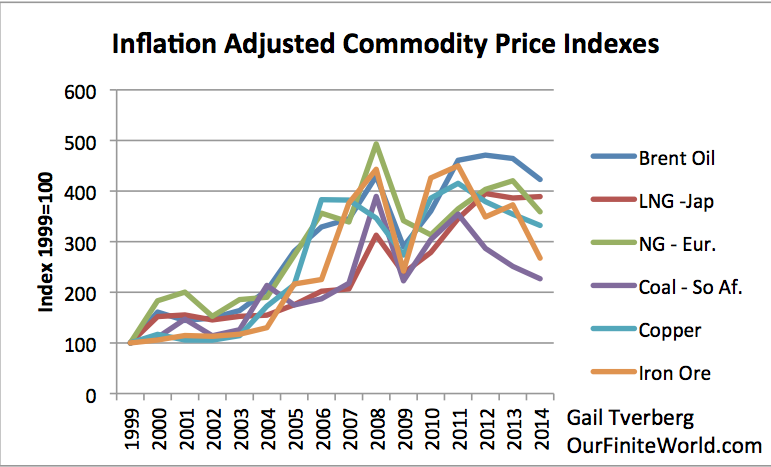 Figure 13. Inflation adjusted prices adjusted to 1999 price = 100, based on World Bank “Pink Sheet” data.
The pattern of many commodities moving together is what we would expect if there were a demand problem leading to low prices. This demand problem would likely reflect several issues:
- The world economy cannot tolerate high priced energy because of the problem shown in Figure 2. We have increasingly used cheaper debt and larger quantities of debt to cover this basic problem, but are running out of fixes.
- The cost of producing energy products keeps trending upward, because we extracted the cheap-to-produce oil (and coal and natural gas) first. We have no alternative but to use more expensive-to-produce energy products.
- Many costs other than energy costs have been trending upward in inflation-adjusted terms, as well. These include fresh water costs, the cost of metal extraction, the cost of mitigating pollution, and the cost of advanced education. All of these tend to squeeze discretionary income in a pattern similar to the problem indicated in Figure 2. Thus, they tend to add to recessionary influences.
- We are now reaching a working population bottleneck as well, as described in Part 4.
Part
6. Oil prices seem to need to be under $60 barrel, and perhaps under
$40 barrel, to encourage demand growth in US, Europe, and Japan.
If
we look at the historical impact of oil prices on consumption for the
US, Europe, and Japan combined, we find that whenever oil prices are
above $60 per barrel in inflation-adjusted prices, consumption tends to
fall. Consumption tends to be flat in the $40 to $60 per barrel range.
It is only when prices are in the under $40 per barrel range that
consumption has generally risen.
 Figure 14. Historical consumption vs. price for the United States, Japan, and Europe. Based on a combination of EIA and BP data.
There
is virtually no oil that can be produced in the under $40 barrel
range–or even in the under $60 barrel a range, if tax needs of
governments are included. Thus, we end up with non-overlapping ranges:
- The amount that consumers in advanced economies can afford.
- The amount the producers, with their current high-cost structure, actually need.
One
issue, with lower oil prices, is, “What kinds of uses do the lower oil
prices encourage?” Clearly, no one will build a new factory using oil,
unless the price of oil is expected to be sufficiently low over the
long-term for this use. Thus, adding industry will likely be difficult,
even if the price of oil drops for a few years. We also note that the
United States seems to have started losing its industrial production in
the 1970s (Fig. 15), as its own oil production fell. Apart from the
temporarily greater use of oil in shale drilling, the trend toward
off-shoring industrial production will likely continue, regardless of
the price of oil.
 Figure
15. US per capita energy consumption by sector, based on EIA data.
Includes all types of energy, including the amount of fossil fuels that
would need to be burned to produce electricity.
Figure
15. US per capita energy consumption by sector, based on EIA data.
Includes all types of energy, including the amount of fossil fuels that
would need to be burned to produce electricity.
If we
cannot expect low oil prices to favorably affect the industrial sector,
the primary impact of lower oil prices will likely be on the
transportation sector. (Little oil is used in the residential and
commercial sectors.) Goods shipped by truck will be cheaper to ship.
This will make imported goods, which are already cheap (thanks to the
rising dollar), cheaper yet. Airlines may be able to add more flights,
and this may add some jobs. But more than anything else, lower oil
prices will encourage people to drive more miles in personal automobiles
and will encourage the use of larger, less fuel-efficient vehicles.
These uses are much less beneficial to the economy than adding high-paid
industrial jobs.
Part 7. Saudi Arabia is not in a position to help the world with its low price oil problem, even if it wanted to.
Many
of the common beliefs about Saudi Arabia’s oil capacity are of doubtful
validity. Saudi Arabia claims to have huge oil reserves, but as a
practical matter, its growth in oil production has been modest. Its oil
exports are actually down relative to its exports in the 1970s, and
relative to the 2005-2006 period.
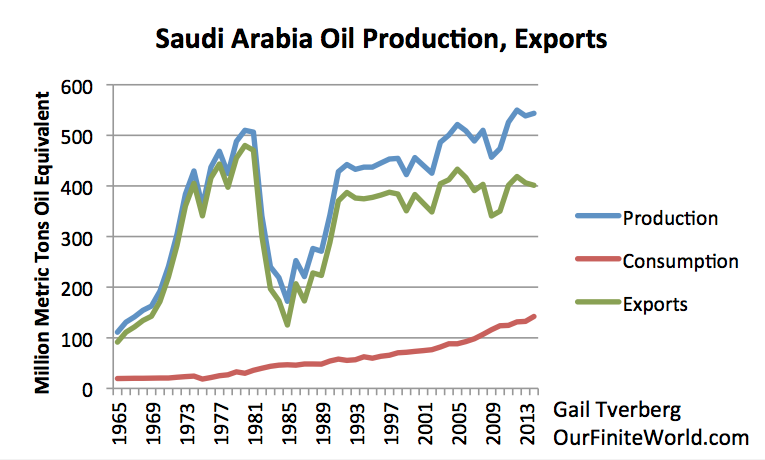 Figure 16. Saudi Arabia’s oil production, consumption, and exports based on BP Statistical Review of World Energy 2015 data.
Low
oil prices are having an adverse impact on the revenues that Saudi
Arabia receives for exporting oil. In 2015, Saudi Arabia has so far issued bonds worth $5 billion US$,
and plans to issue more to fill the gap in its budget caused by falling
oil prices. Saudi Arabia really needs $100+ per barrel oil prices to
fund its budget. In fact, nearly all of the other OPEC countries also
need $100+ prices to fund their budgets. Saudi Arabia also has a growing
population, so it needs rising oil exports just to maintain its 2014
level of exports per capita. Saudi Arabia cannot reduce its exports by
10% to 25% to help the rest of the world. It would lose market share and
likely not get it back. Losing market share would permanently leave a
“hole” in its budget that could never be refilled.
Saudi Arabia and a number of the other OPEC countries have published “proven reserve” numbers that are widely believed to be inflated.
Even if the reserves represent a reasonable outlook for very long term
production, there is no way that Saudi oil production can be ramped up
greatly, without a large investment of capital–something that is likely
not to be available in a low price environment.
In the United
States, there is an expectation that when estimates are published, the
authors will do their best to produce correct amounts. In the real
world, there is a lot of exaggeration that takes place. Most of us have
heard about the recent Volkswagen emissions scandal and the uncertainty regarding China’s GDP growth rates.
Saudi Arabia, on a monthly basis, does not give truthful oil production
numbers to OPEC–OPEC regularly publishes “third party estimates” which
are considered more reliable. If Saudi Arabia cannot be trusted to give
accurate monthly oil production amounts, why should we believe any other
unaudited amounts that it provides?
Part 8. We seem to be
at a point where major debt defaults will soon start for oil and other
commodities. Once this happens, the resulting layoffs and bank problems
will put even more downward pressure on commodity prices.
Wolf Richter has recently written about huge
jumps in interest rates that are being forced on some borrowers. Olin
Corp., a manufacture of chlor-alkali products, recently attempted to
sell $1.5 billion in eight and ten year bonds with yields of 6.5% and
6.75% respectively. Instead, it ended up selling $1.22 billion of bonds
with the same maturities, with yields of 9.75% and 10.0% respectively.
Richter also mentions
existing bonds of energy companies that are trading at big discounts,
indicating that buyers have substantial questions regarding whether the
bonds will pay off as expected. Chesapeake Energy, the second largest
natural gas driller in the US, has 7% notes due in 2023 that are now
trading at 67 cent on the dollar. Halcon Resources has 8.875% notes due
in 2021 that are trading at 33.5 cents on the dollar. Lynn Energy has
6.5% notes due in 2021 that are trading at 23 cents on the dollar.
Clearly, bond investors think that debt defaults are not far away.
The latest round of twice-yearly reevaluations is under way, and almost 80 percent of oil and natural gas producers will see a reduction in the maximum amount they can borrow, according to a survey by Haynes and Boone LLP, a law firm with offices in Houston, New York and other cities. Companies’ credit lines will be cut by an average of 39 percent, the survey showed.
Debts of mining companies are also being affected with today’s low prices of metals. Thus, we can expect defaults and cutbacks in areas other than oil and gas, too. There
is a widespread belief that if prices remain low, someone will come
along, buy the distressed assets at low prices, and ramp up production
as soon as prices rise again. If prices never rise for very long,
though, this won’t happen. The bankruptcies that occur will mean the end
for that particular resource play. We won’t really be able to get
prices back up to where they need to be to extract the resources.
Thus
low prices, with no way to get them back up, and no hope of making a
profit on extraction, are likely the way we reach limits in a finite
world. Because low demand affects all commodities simultaneously,
“Limits to Growth” equates to what might be called “Peak Resources” of
all kinds, at approximately the same time.
http://www.theenergycollective.com/gail-tverberg/2277283/low-oil-prices-why-worry
No comments:
Post a Comment